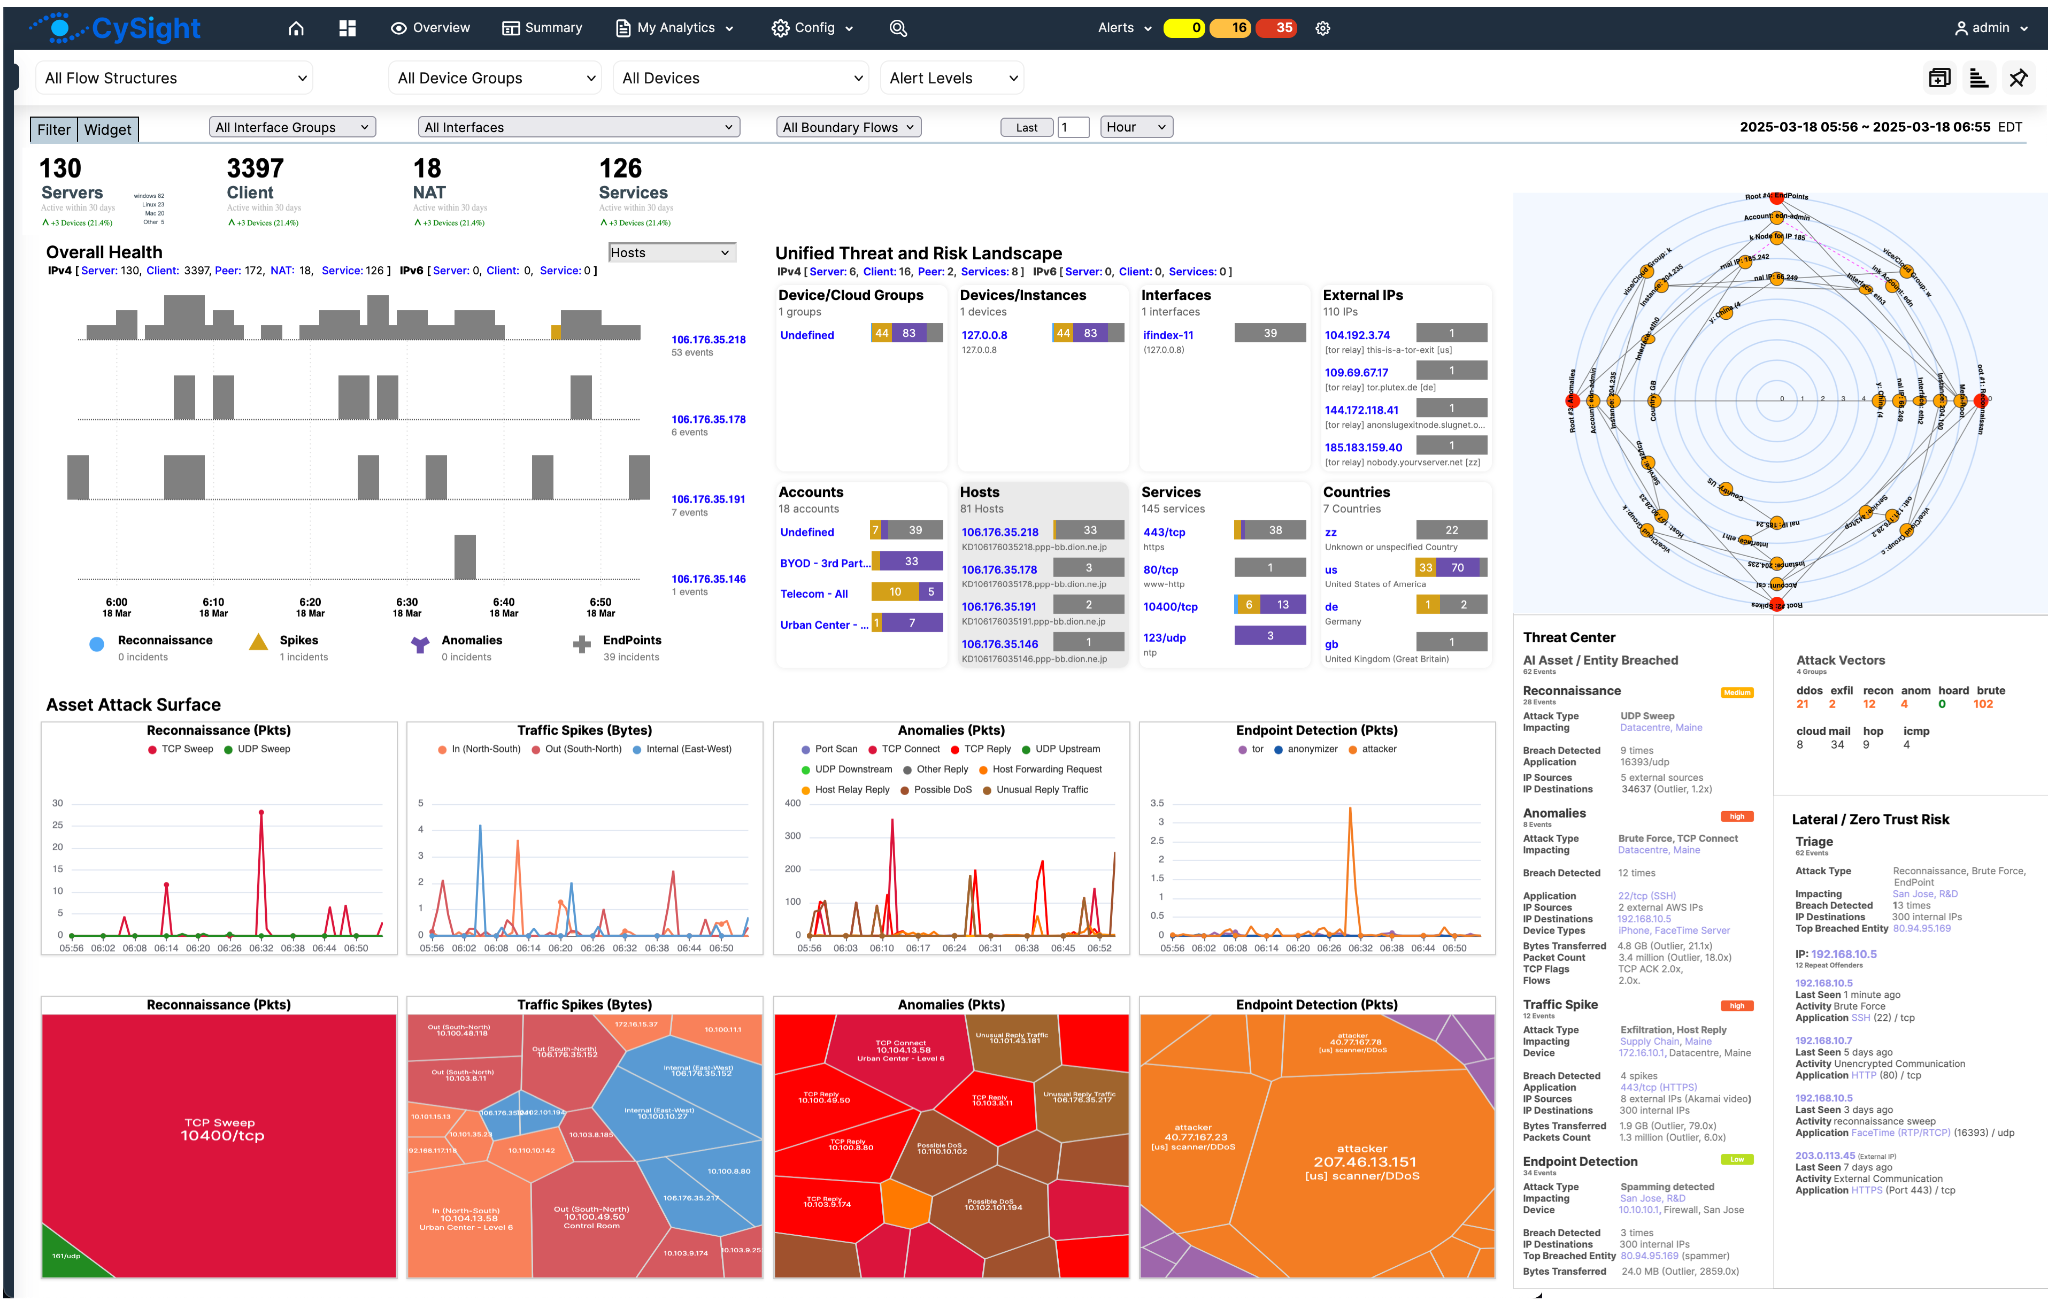
The Threat & Risk Dashboard is the central hub for CySight’s advanced AI-driven threat detection and network forensics.
It provides security teams with immediate, actionable visibility into real-time network anomalies, reconnaissance activity, lateral movements, endpoint risks, and threat vectors.
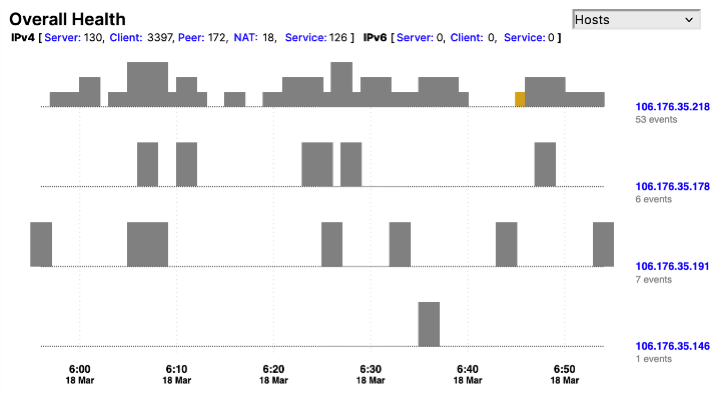
Overall Health
Visualizes spikes, anomalies, endpoint activity, and reconnaissance attempts over time.
Clicking on bars or labels (e.g., EndPoints, Anomalies) allows drill-down into host behavior and associated flows. Monitors live anomalies, endpoint behavior, and scanning activity over time using a bar chart layout.
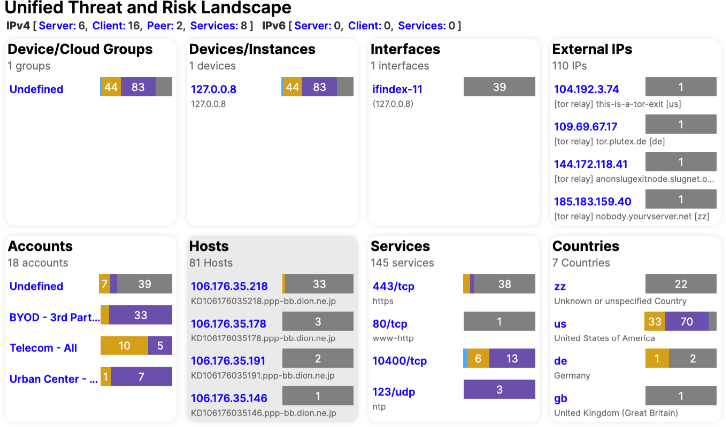
Unified Threat and Risk Landscape
Tracks categories such as Reconnaissance, Spikes, Anomalies, and Endpoint events.
Hover to view timestamped activity and affected hosts.
Ideal for SOC teams to detect timing of coordinated scans or attack bursts.
Enables instant drill-down into source and nature of each bar element.
A quick-glance view of network behavior fluctuations over the selected time window.
Real-time correlation of threats across devices, services, countries, external IPs, and user accounts.
Useful for identifying breach surfaces and assessing exposure.
Threat Center
The Threat Center offers a circular real-time visualization of attacker-to-victim relationships across the network.
Asset Attack Surface
Nodes represent internal assets and external entities.
Arrows and connections display attack vectors, communication paths, and relationship intensity.
Highlights attacker roles, protocols used (e.g., TCP, UDP), ports targeted, and number of breaches.
Instant situational awareness of the spread, type, and origin of threats.
Clicking on nodes or links provides detailed diagnostics and direct pivot into associated traffic or endpoint activity.
A series of rich visualizations breaking down network traffic abnormalities and active threats per category.
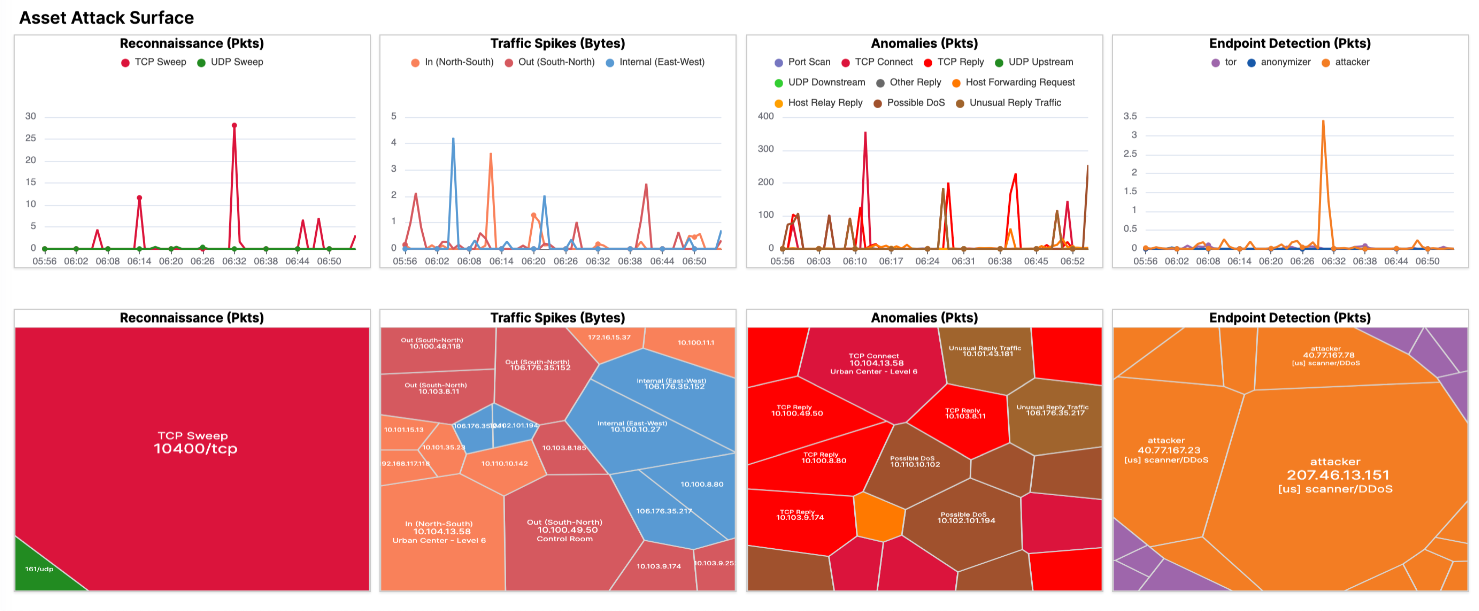
Includes:AI Forensics Heatmaps
Reconnaissance (Pkts): Sweep attempts by type (TCP/UDP).
Traffic Spikes (Bytes): Directional spikes across network boundaries (North-South, East-West).
Anomalies (Pkts): Protocol-specific issues, floods, malformed flows, retries.
Endpoint Detection (Pkts): Behavior-based detection of attacker IPs and anonymizers.
Tree visualizations highlight most frequent offenders and behaviors, using color for severity and size for impact.
Tree and block visualizations show volume and severity by color and size.
Identify most targeted ports, IPs, and attack types with a single glance.
Lateral / Zero Trust Risk Triage
This panel breaks down the risk trajectory, identity, and behavioral analysis of internal threat propagation.

Use Cases:
Categorizes threats by type (e.g., brute force, reconnaissance, traffic anomalies).
Maps the source, user, ASN, and geolocation.
Shows high-risk paths based on real-time traffic patterns and business asset exposure.
Links endpoint activity with application usage and identity.
Correlates user identity, asset, application, and threat type.
Exposes trust violations, internal pivoting, and target risk level.
Used to validate Zero Trust posture and stop lateral movements before compromise deepens.
Triage real-time alerts and drill into threat diagnostics.
Investigate anomalies by time and topology.
Identify which services and devices are most exposed or under attack.
Track the lifecycle of an attack from reconnaissance through to impact.
For more visualizations including Sankeys, Circlepacks, and animated diagnostics, see:
Visualizations