Visual Analytics enables a more direct method to present network traffic than traditional charts. CySight visualizations support IP, Account, CostCentre, AS and Interface "Point-to-Point" traffic graphs using a variety of visual techniques. You will need an html5 compatible browser to see the visualizations.
CySight provides various Visual Analytic techniques: Topology, Force graphs, Chords and Bundles. Other extended visualizations for Dashboards, CirclePacks Treemaps, Voronoi, Geolocation analytics can be seen in the Visualization Overview with some useful animations Visualizations.
Topology visual analytics is a kind of force graph but one that includes the gateways through which the network traffic is traversing. Where Link analysis visuals presents the Point-to-Point traffic directly.
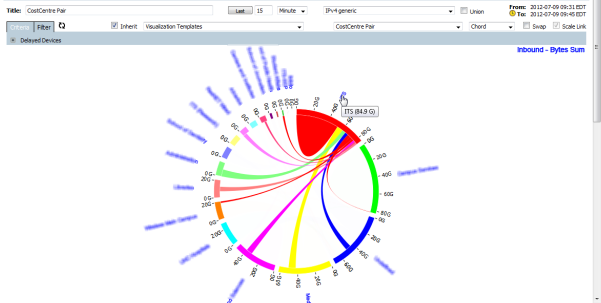
Chord Graph
The chord graph presents a Pair matrix network traffic analysis, the arc band presents each traffic Pair.
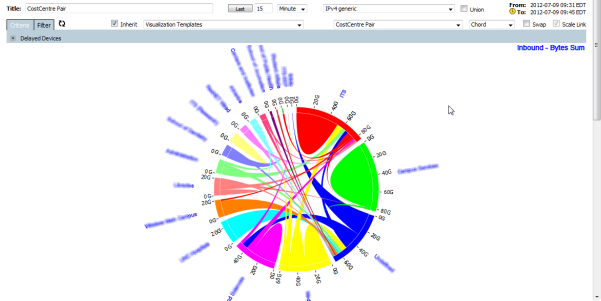
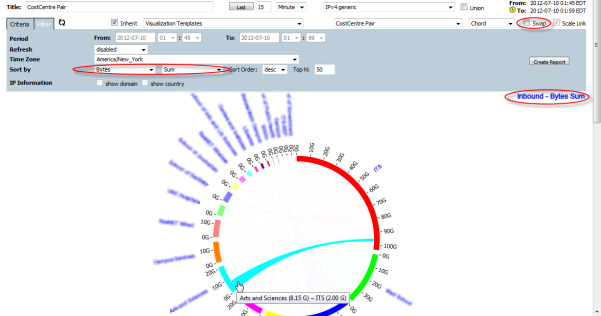
The width at the end of the arc band reflects the traffic measurement between the Pairs. Traffic measurement can be optionally viewed in Bytes, bits-per-second (bps) Packets, and packets-per-second (pps) etc using the Filter tab. The measurement can also be swapped to reflect Inbound or Outbound.
Placing your mouse over an arc band will hide all the other arc bands. Clicking an arc will provide a drilldown analysis represented using a MultiView with the Pair as criteria.
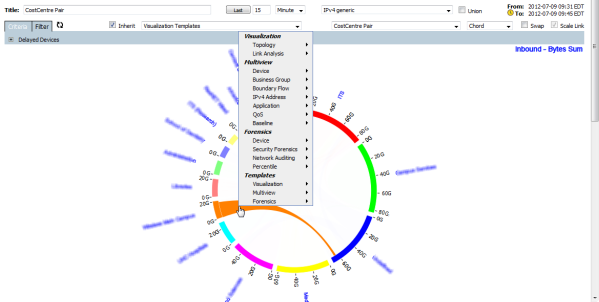
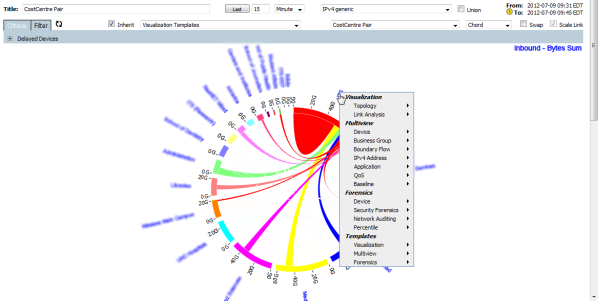
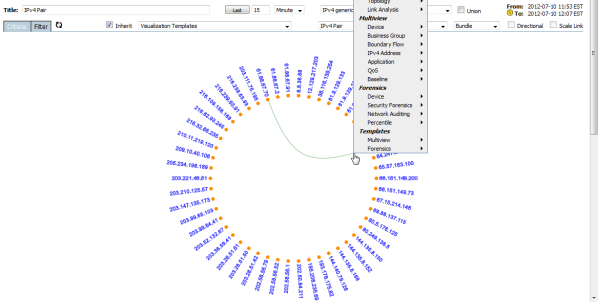
Right-clicking on an arc band will display the popup menu enabling drilldown to a Visualization, Multiview, Forensics or your own template using point-to-point criteria.
The arc edge size presents the total traffic measurement to/from one element. Placing your mouse over an element will only show the arc bands relative to it, and hide all other arc bands.
Right clicking on an element will display the popup menu enabling drilldown to a Visualization, Multiview, Forensics or your own template using the element as the criteria.
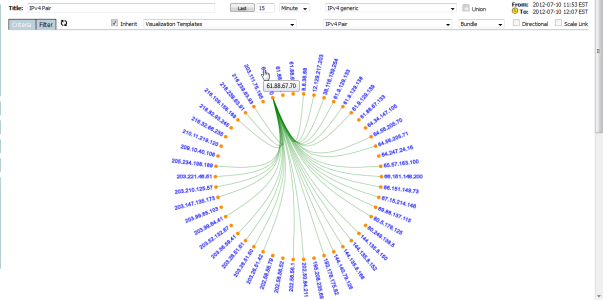
Bundle Graph
The bundle graph clearly shows a Pair matrix relationship, but does not show traffic measurement such as that shown in a chord graph.
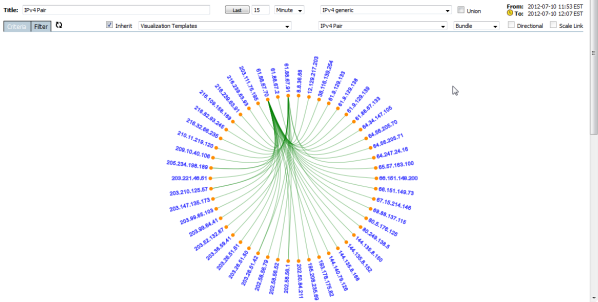
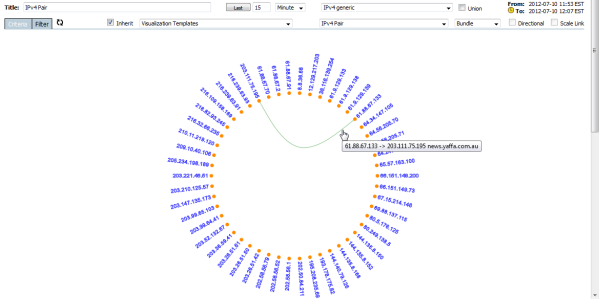
Placing your Mouse over an arc will hide all other arcs. Clicking on the arc enables fast drilldown to a MultiView analysis using the Pair as the criteria on which to filter.
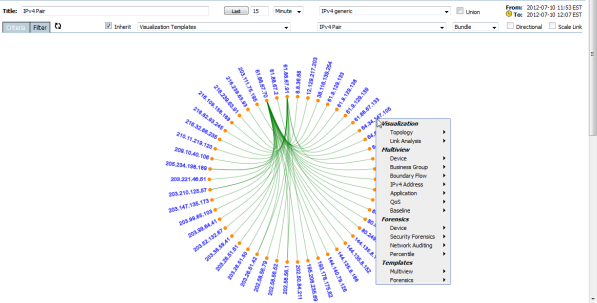
Right-clicking on an arc will display the popup menu enabling drilldown to a Visualization, Multiview, Forensics or your own template using point-to-point criteria.
Placing your Mouse over an element will show only the elements conversations. Clicking on the element enables fast drilldown to a MultiView analysis using the element as the criteria on which to filter.
Right-clicking on an element will display the popup menu enabling drilldown to a Visualization, Multiview, Forensics or your own template using the elements criteria.
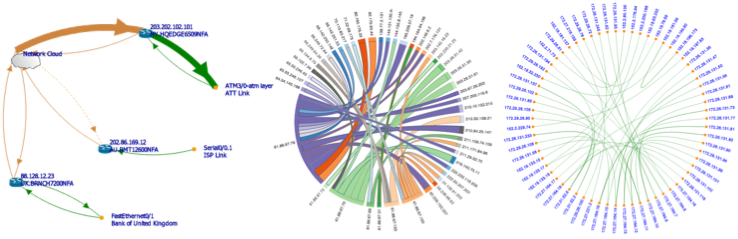
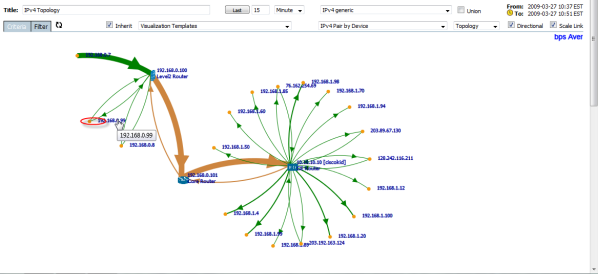
Topology Visualizations
The topology visualization can present "hop" traffic between a series of gateways such as routers, switches and firewalls once the routers and/or switches linkage is setup.
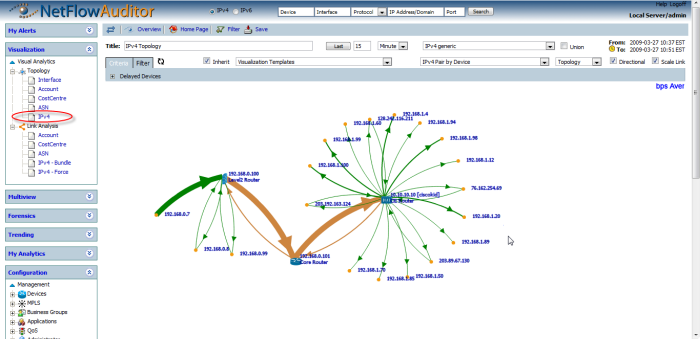
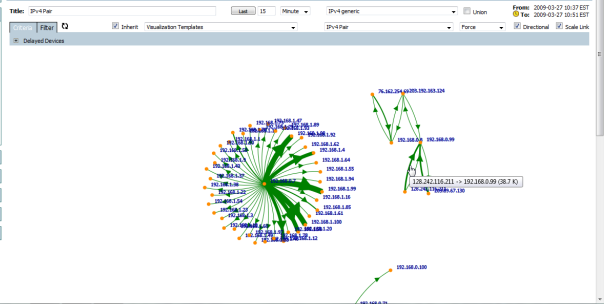
The nodes on any of the visualization graphs can be double-clicked to drilldown whilst retaining the node as criteria.
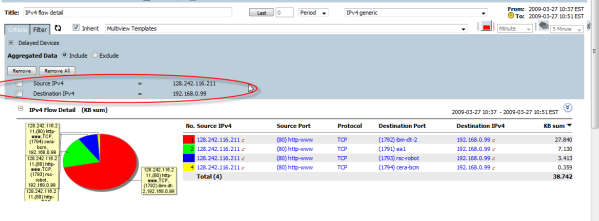
The arc of a visualization can also be double-clicked to quickly drilldown to see the flow detail directly in a MultiView analysis using the full point-to-point criteria as the filter
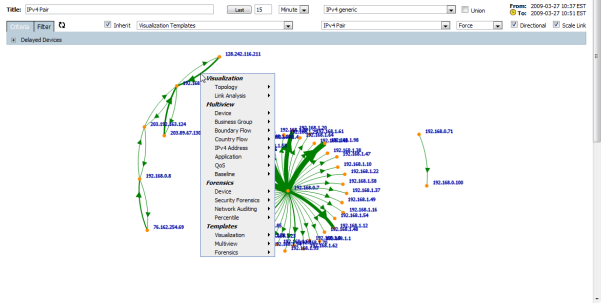
The nodes on the visualization graph can be right-clicked which will open a popup menu that enables fast drilldown to another Visualization, Multiview or Forensic perspective using the node as the criteria on which to filter.
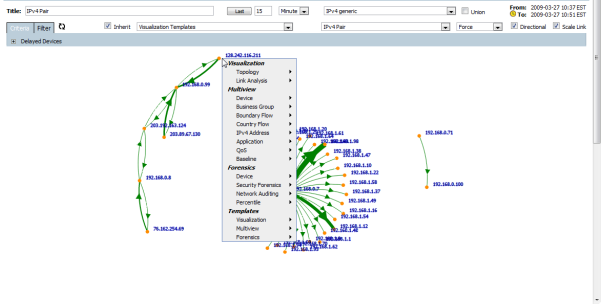
The arc of visualization can also be right-clicked to open the popup menu for easy drilldown to another Visualization, Multiview or Forensic analytic using the full point-to-point criteria as the filter.
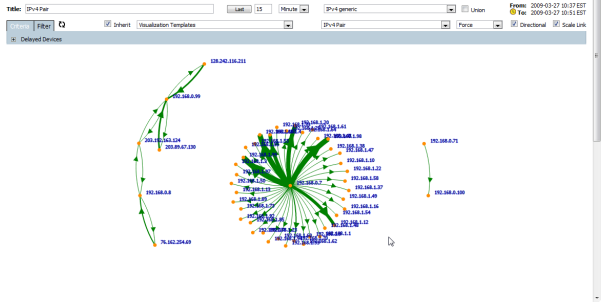
Force Graphs
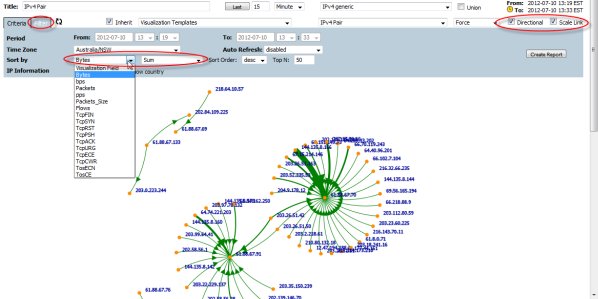
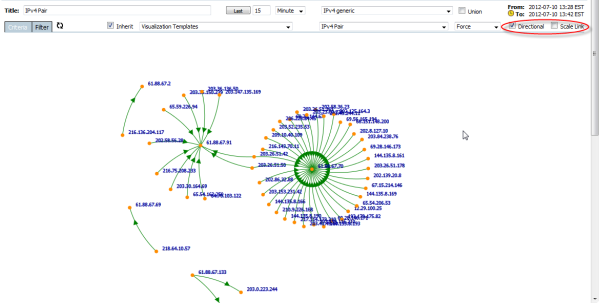
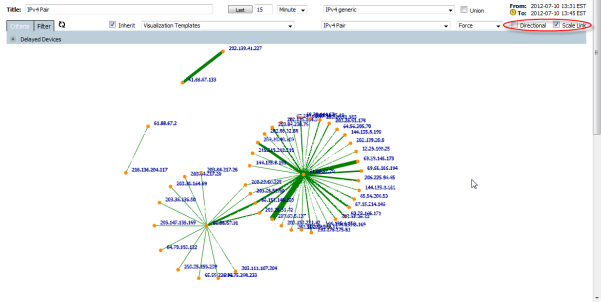
The force graph can be directional and can scale according to the measurement criteria requested. The link scale can also be selected from the "Filter" tab and can form part of a saved template.
The force graph can be directional without showing the scale.
The force graph can show scale only without showing direction.
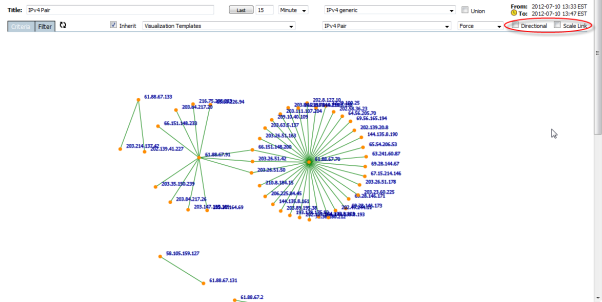
The force graph can exclude both scale and direction to simply show point-to-point analytics.
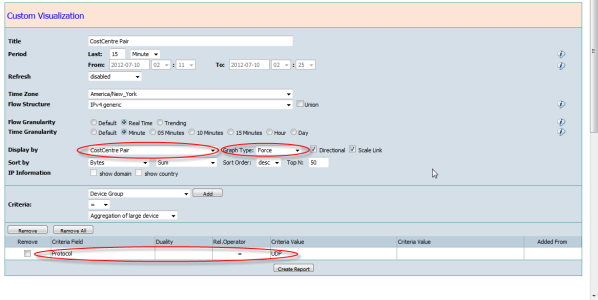
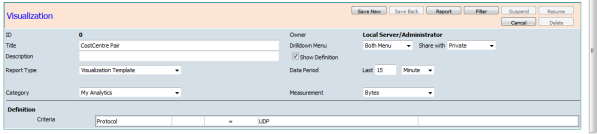
Custom Visualizations
Click "Visualization" under "Custom Filter" in "My Analytics" panel left menu, or;
Click the "Filter" icon button on top of any existing visualization screen to customize a visualization.
Choose reporting element: Interface, Account, CostCentre, AS or IP addresses.
Choose the graph type: Bundle, Chord, Force.
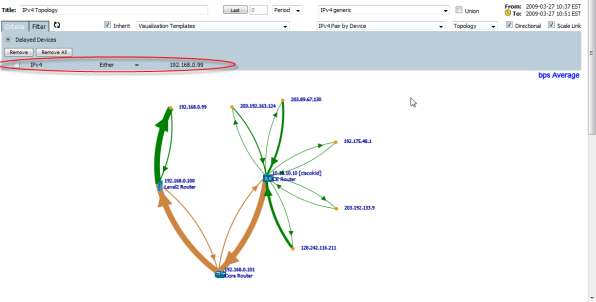
Pairing by Device will automatically display a topology graph based on the link setup.
Visualizations can be filtered to display specific traffic with unique criteria.
Visualization Template
Any customized visualization can be saved as a template accesible via the right-click popup. This enables you to easily to redo existing drilldowns from any analytic.
Notes:
Scheduled Visualization is not supported currently. Look out for this feature in an upcoming version.