CySight provides a number of easy options to enhance a report by changing the time period or timezone or display fields or by refining the Criteria of the report.
Different Multiview, Forensics or Visual Analytic perspectives of any data in a Multiview analysis are available via right-click drilldown menus or by employing the left-menu to inherit periods and criteria. This provides an unprecedented granularity and flexibility for performance monitoring, bandwidth utilization, absolute network visibility and root cause analysis. Coupled with superior scalability CySight exceeds the capabilities of any other Netflow analyzer.
The IPv4 and IPv6 option at the top of the screen allows you to quickly switch between IPv4 and IPv6 flow data whilst retaining all other report options and where possible maintaining the criteria.
Where criteria contain IP fields the view will revert to the "Custom Multiview" screen when swapping between IPv4 and IPv6.
The top quick-search toolbar allows a quick lookup of Devices and/or Interfaces and/or Protocols, and/or IPs, and/or Ports.
Devices and Interfaces allow matching using the '%' wildcard character.
Toolbar Buttons
- "show/hide" - show/hide left menu
- "Overview" - go to device and top interfaces overview page
- "Homepage" - go to homepage defined in user default option.
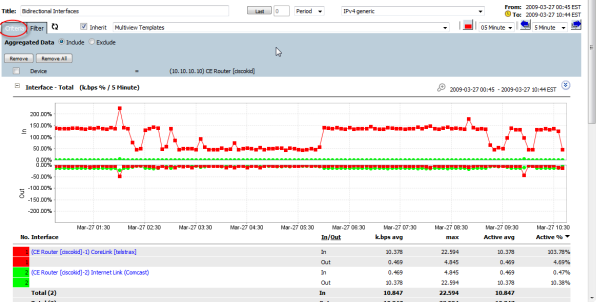
- "Filter" - click to "Custom Multiview screen" while bring all current options in.
- "Save" - save the multiview as template or schedule report.
- "PDF" - generate a pdf report with current queried data.
- "CSV" - generate a csv report with current queried data.
The name of the current multiview report
Last
Click to build the report with a new time period as required N Minute, Hour, Day etc as period.
Flow Structure
Change the Flow Structure and redo the report whilst retaining all other report options.
Auto Refresh icon
Toggle on/off automatic refresh for the current multiview report.
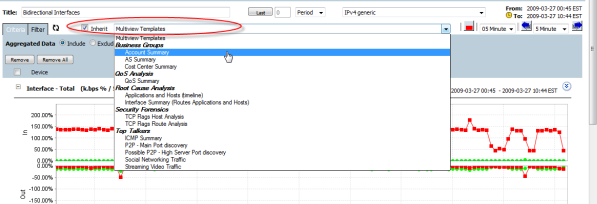
Inherit
Allows the current Mutiview template to retain the current criteria and period. Inherit is on by default.
"show/hide Other" icon
Will rebuild the report including or excluding the balance of the data which is reflected as "Other".
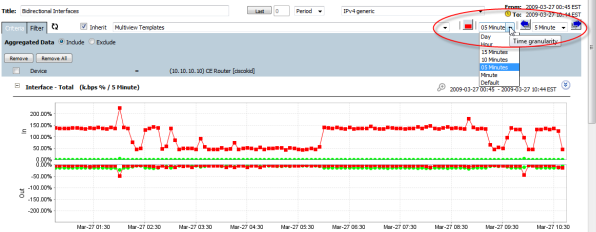
"Time Granularity"
Allows the time resolution to be changed for the current report. Changing the time granularity will cause the report to be rebuilt.
"Left" and "Right" move icons
Enables the period window to be shifted back or forward in time in increments of the time step defined.
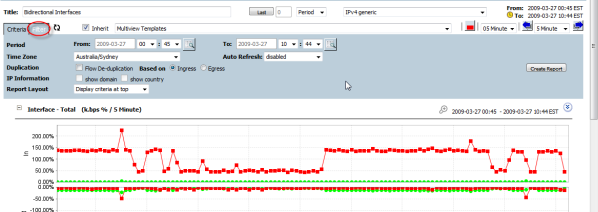
Criteria Tab
Aggregated Data
Rebuilds the current report including or excluding aggregated data (Data aggregated by License Key, Data Collection Tuning or Data Retention Policies).
"Remove"/"Remove All"
Rebuilds the report excluding one or more of the current criteria.[/list]
Clicking the folder+plus in the Left Menu will generate the requested left menu report whilst inheriting the current criteria and period.Filter Tab
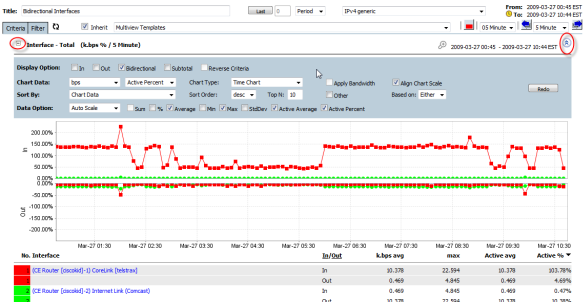
The "plus" icon to the top-left of each sub-report is used to show/hide the sub-report.
The "double arrow" icon to the top-right of each sub-report provides toolbox to change the sub-report options and rebuild the report.
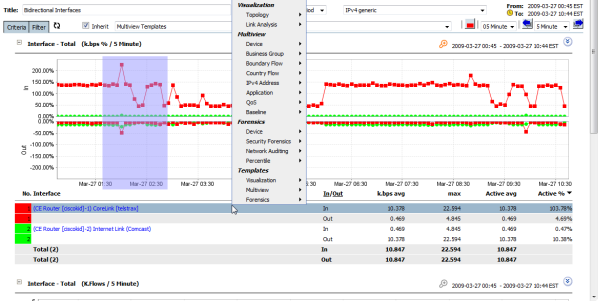
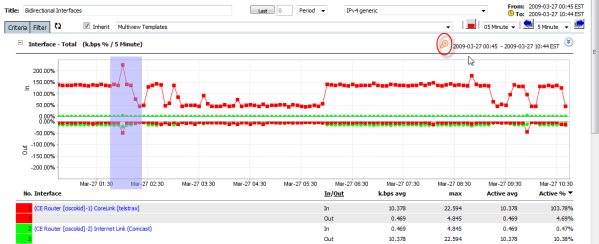
Using the left-click and drag allows part of a time or stacked area chart to be highlighted. This will enable the "zoom" icon. Clicking the "zoom" icon will rebuild the report with the highlighted period.
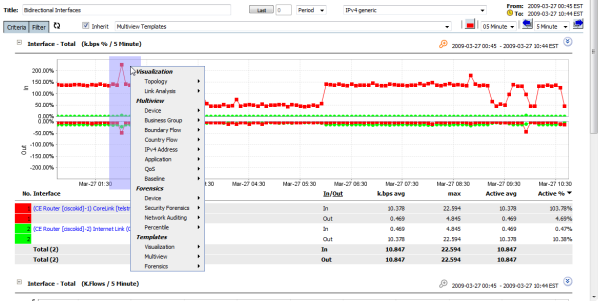
Right-clicking on the highlighted part of a time or stacked area chart opens a popup menu to allow drilldown to any other Multiview, Forensics or Visual analytic of the zoomed period.
Right-clicking on the grid record opens a popup menu to allow drilldown to any other Multiview, Forensics or Visual analytic of the grid item selected. If a section of a time or stacked period has already been highlighted then the selected period will also reflect in the subsequent view.
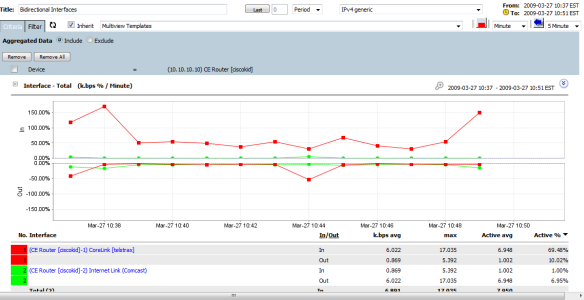
Left-Clicking on the grid item retains the current Multiview structure displaying only the grid item selected and any time period concurrently selected.