CySight learns network behaviors and provides unparalleled network data intelligence providing enhanced security and intrusion detection. Behavior detection quickly identifies network anomalies and working together with the in-built analytical tools allow total visibility helping to eliminate network blindspots to resolve security and performance issues across business services and applications, dramatically reducing the risk of data leakage and potential business downtime.
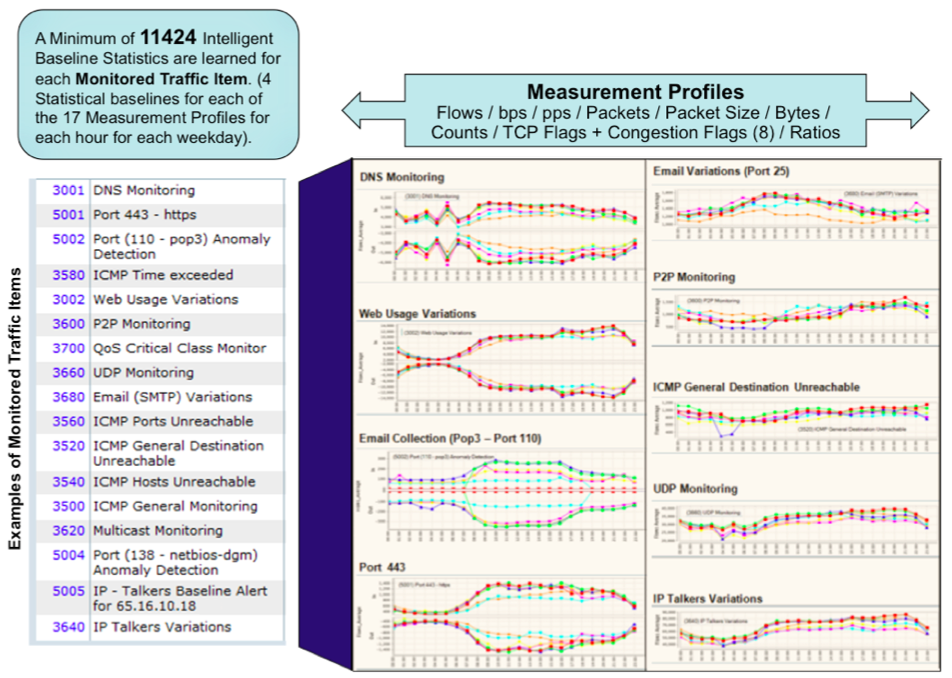
Multiple Baselines are learned for each Detection profile. A Minimum of 11424 Intelligent Baseline Statistics are learned for each Monitored Traffic Item. (4 Statistical baselines for each of the 17 Measurement Profiles for each hour for each weekday).
Measurement Profiles include Flows, bps, pps, packets, packet size , bytes, counts, TCP Flags + Congestion Flags.
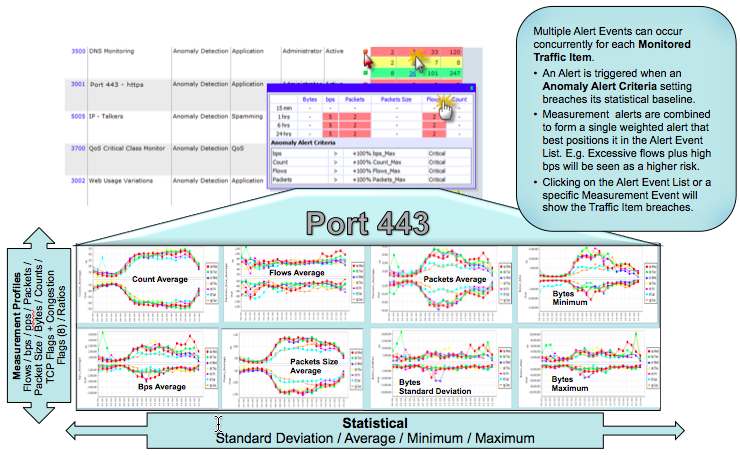
Multiple Alert Events can occur concurrently for each Monitored Traffic Item.
An Alert is triggered when an Anomaly Alert Criteria setting breaches its statistical baseline.
Measurement alerts are combined to form a single weighted alert that best positions it in the Alert Event List. E.g. Excessive flows plus high bps will be seen as a higher risk.
Clicking on the Alert Event List or a specific Measurement Event will show the Traffic Item breaches.
Statistical baselines are learned for each measurement profile: Standard Deviations, Averages, Minimums and Maximums.
Current and previous Intelligent Baseline Network Behavior Anomaly Detection Alerts (Baseline Alert or IB-NBAD) can be viewed from the Alerts Screen.
The alerts where the majority of baselines have been breached over the last period selected will show at the top of the alert page.
The Baseline Alerts Menu, Information and Maintenance Screens
Clicking on the left menu "Baseline Alert" under "Anomaly Detection" in "My Analytics" will list all generated Baseline Alerts in the "Alert" screen.
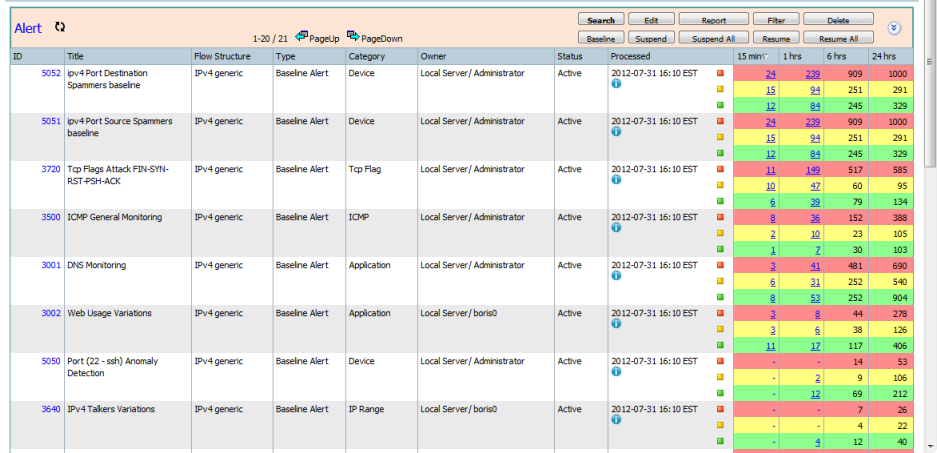
The "Alerts" screen allows maintenance operations on the existing Baseline Alerts. The bold button reflects the current command status.
- Search - Click the "Search" button to expand the fields panel. Choose operator and enter value, then press "Confirm" button to list the matched Baseline Alerts.
- Edit - Click the "Edit" button and highlight a Baseline Alert in the grid, then press "Confirm" to modify the Baseline Alert saving parameters.
- Report - Click the "Report" button and highlight a Baseline Alert in the grid, then press "Confirm" to go to Forensics Report to check or adjust the "Forensics" options.
- Filter - Click the "Filter" button and highlight a Baseline Alert in the grid, then press "Confirm" to go to "Custom Forensics" to adjust the "Forensics" options and criteria.
- Delete - Click the "Delete" button and highlight a Baseline Alert in the grid, then press "Confirm" to delete the highlighted Baseline Alert as well its as baselined data.
- Baseline - Click the "Baseline" button and highlight a Baseline Alert in the grid, then press "Confirm" to go into "Baseline Data" screen.
- Suspend - Click the "Suspend" button and highlight a Baseline Alert in the grid, then press "Confirm" to suspend the alerting schedule instance of the highlighted Baseline Alert.
- Suspend All - Click the "Suspend All" button, then press "Confirm" to suspend all current listed "Baseline Alerts" alerting schedule instance.
- Resume - Click the "Resume" button and highlight a Baseline Alert in the grid, then press "Confirm" to resume the alerting schedule instance of the highlighted Baseline Alert.
- Resume All - Click the "Resume All" button, then press "Confirm" to resume all current listed "Baseline Alert" alerting schedule instances.
The baseline data will be cleaned and re-learned when the key baseline definition has been changed, e.g. criteria, dimension.Clicking on the left menu "Baseline Build" under "Anomaly Detection" in "My Analytics" will list all generated Baseline Alerts in the "Alert" screen.
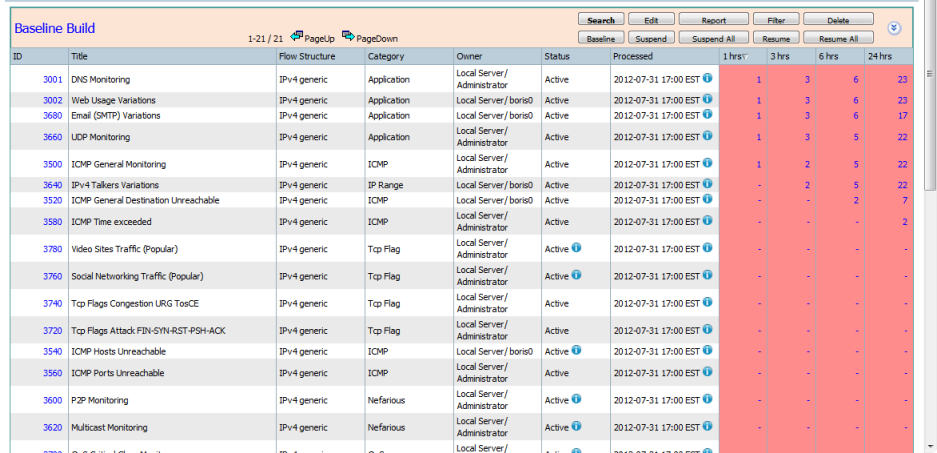
The "Baseline Build" screen
allows maintenance operations on the existing "Baseline Alert" learning schedule instances. The bold button reflects the current command status.
- Search - Click the "Search" button to expand the fields panel. Choose operator and enter value, then press "Confirm" button to list the matched "Baseline Alert" learning schedule instances.
- Edit - Click the "Edit" button and highlight a "Baseline Alert" in the grid, then press "Confirm" to modify the Baseline Alert saving parameters.
- Report - Click the "Report" button and highlight a Baseline Alert in the grid, then press "Confirm" to go to Forensics Report to check or adjust the "Forensics" options.
- Filter - Click the "Filter" button and highlight a Baseline Alert in the grid, then press "Confirm" to go to "Custom Forensics" to adjust the "Forensics" options and criteria.
- Delete - Click the "Delete" button and highlight a Baseline Alert in the grid, then press "Confirm" to delete the highlighted Baseline Alert as well its as baselined data.
- Baseline - Click the "Baseline" button and highlight a Baseline Alert in the grid, then press "Confirm" to go into "Baseline Data" screen.
- Suspend - Click the "Suspend" button and highlight a Baseline Alert in the grid, then press "Confirm" to suspend the learning schedule instance of the highlighted Baseline Alert.
- Suspend All - Click the "Suspend All" button, then press "Confirm" to suspend all current listed "Baseline Alerts" learning schedule instance.
- Resume - Click the "Resume" button and highlight a Baseline Alert in the grid, then press "Confirm" to resume the learning schedule instance of the highlighted Baseline Alert.
- Resume All - Click the "Resume All" button, then press "Confirm" to resume all current listed "Baseline Alert" learning schedule instances.
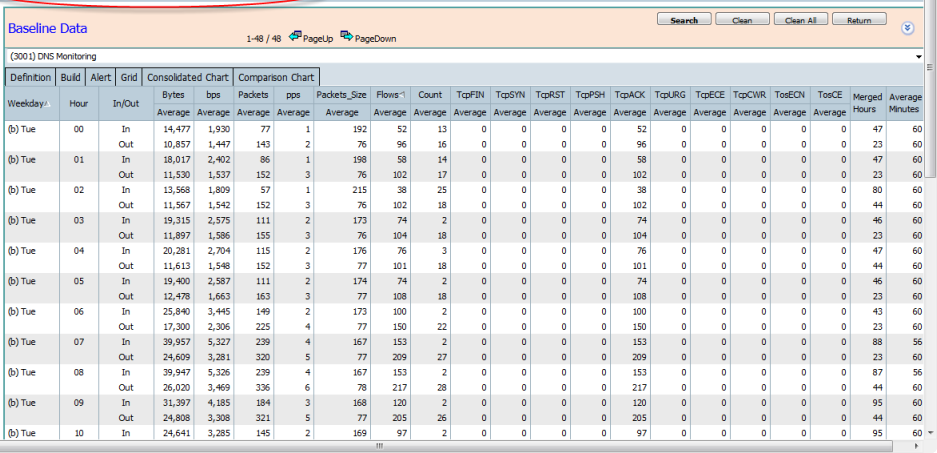
Selecting and highlighting an Anomaly Detection Baseline Alert in the "Alert" and "Baseline Build" screen and Clicking the "Baseline" button opens the Baseline Data screen
Toolbar Buttons
- "show/hide" - Allows the left menu to be revealed or hidden.
- "Overview" - Open the Interfaces Bandwidth Utilization overview page.
- "Homepage" - Opens the Default Homepage (configurable in My Analytics panel > Default Options).
- "Report" - Go to Forensics Report to check or adjust the Baseline Alert "Forensics" options..
- "Filter" - Go to "Custom Forensics" screen to adjust the "Forensics" options and criteria.
- "Edit" - Go to "Baseline" saving screen.
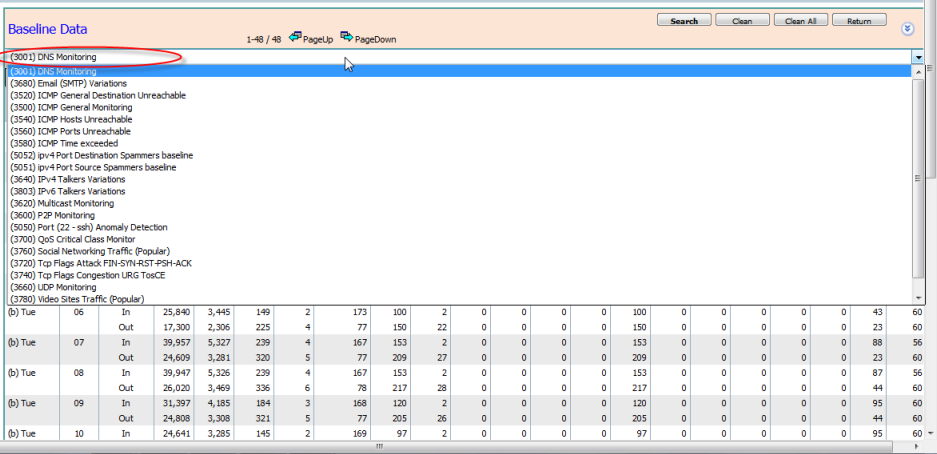
The drop down list at the top of the screens allows another baseline alert to be selected.
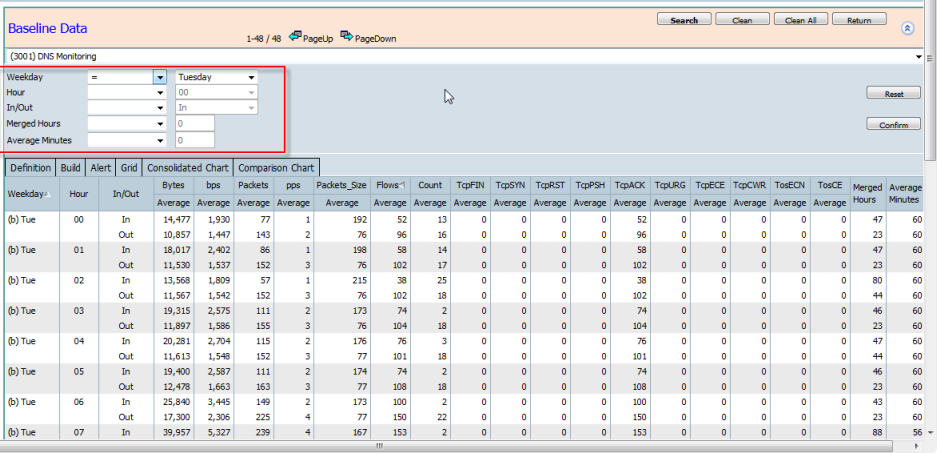
The "Search" button
Clicking on the "Search" button will expand the fields panel. Choose operators and enter values then press the "Confirm" button to list the matched baseline data.
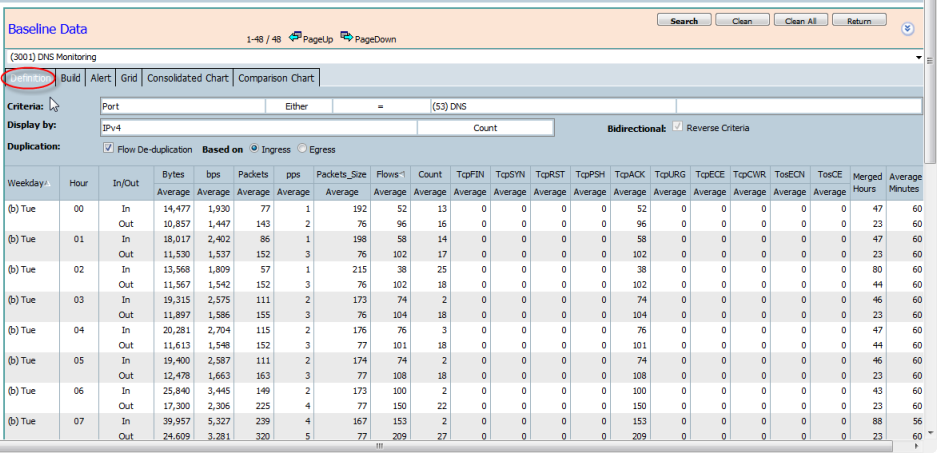
The "Definition" tab
shows the traffic definition for the baseline data.
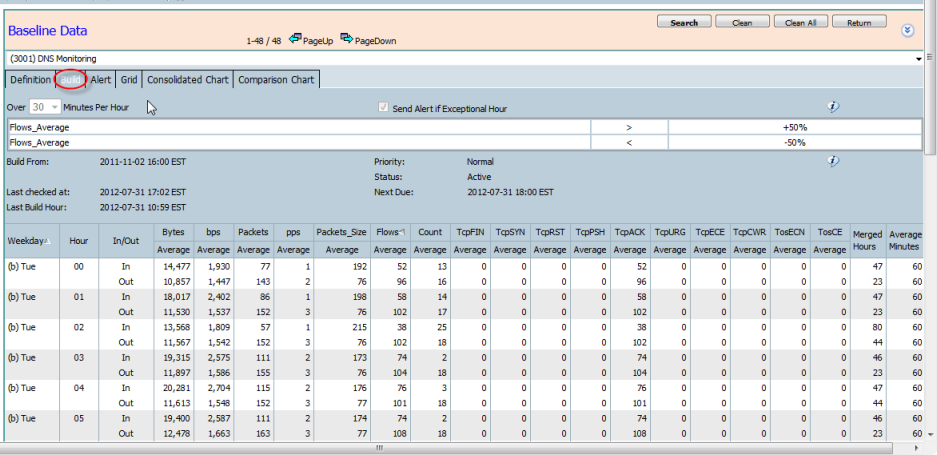
The "Build" tab
shows the learning schedule instance definition for the baseline data.
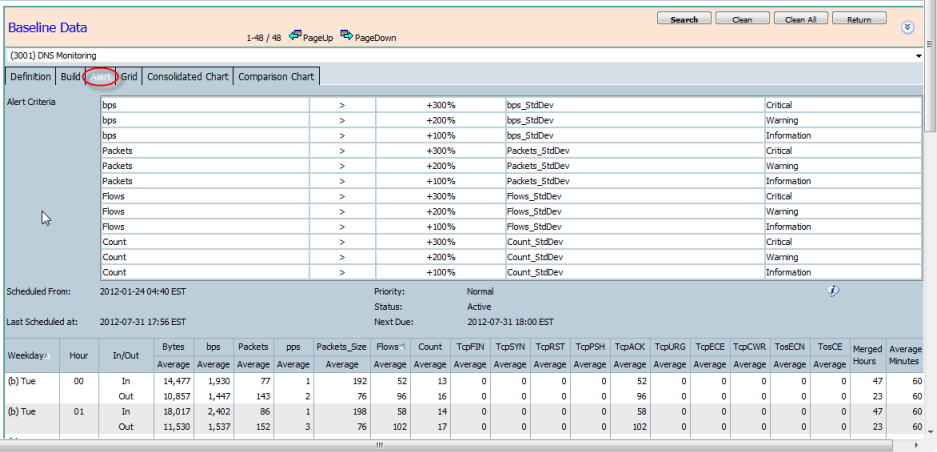
The "Alert" tab
shows the criteria and schedule information of an alerting schedule instance for the baseline data.
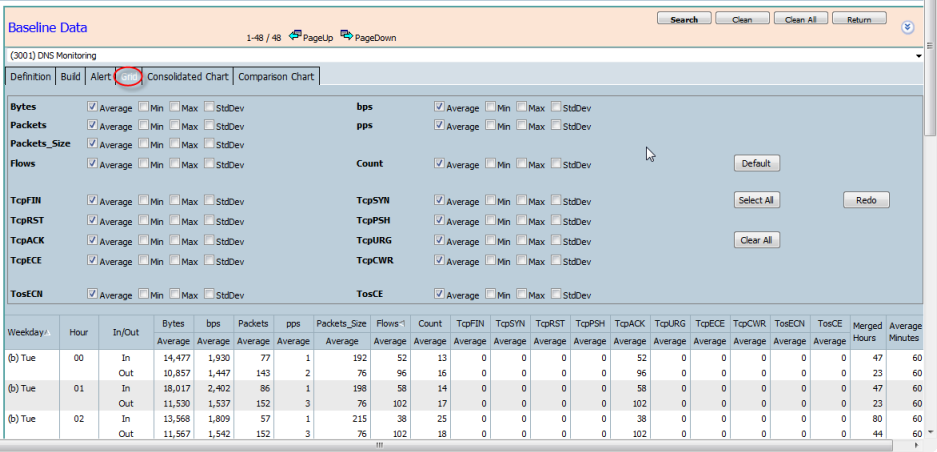
The "Grid" tab
allows the choice of which measurement statistics to be shown in the grid.
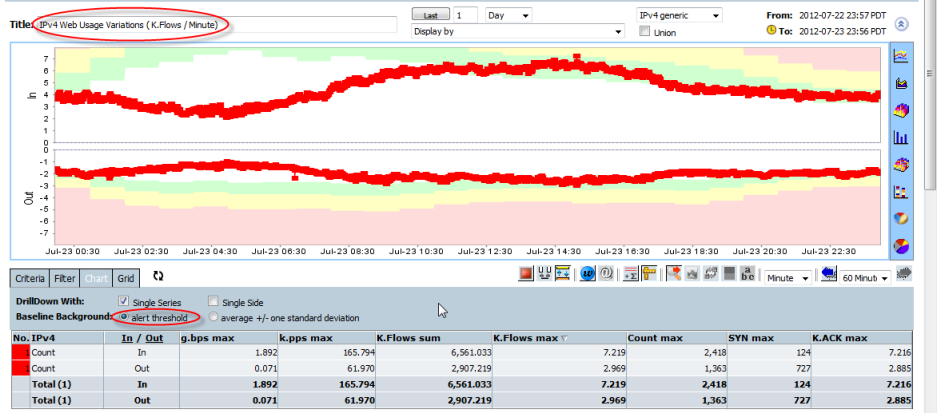
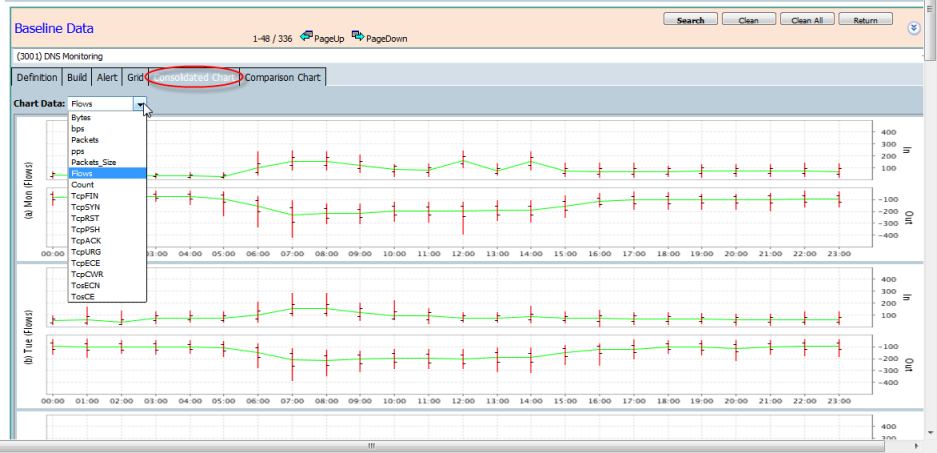
The "Consolidated Chart" tab
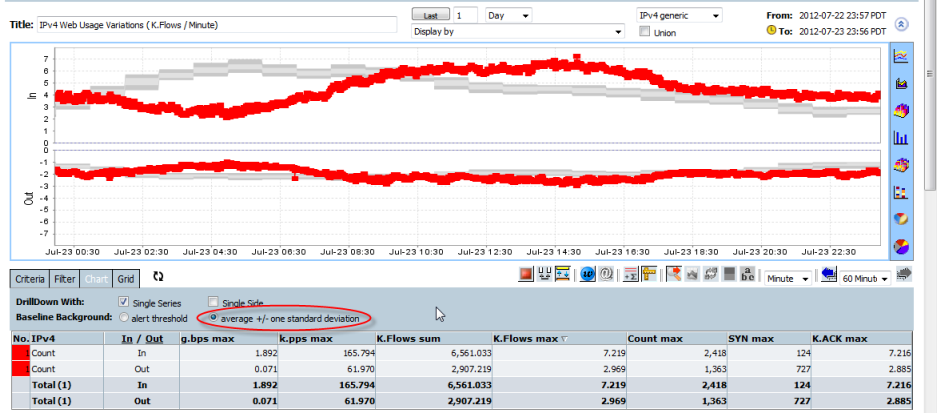
shows the chart with one measurement of baseline data including the minute max, min, and +/- one standard deviation on average for each hour, each weekday.
The measurement can be changed for the chart.
Using Search and clearing the operators allows all hourly data for all weekdays baseline data to be displayed. This is useful to see all Baselines for the current selected Alert and for the current selected Measurement side-by-side for Consolidated and Comparison Charts
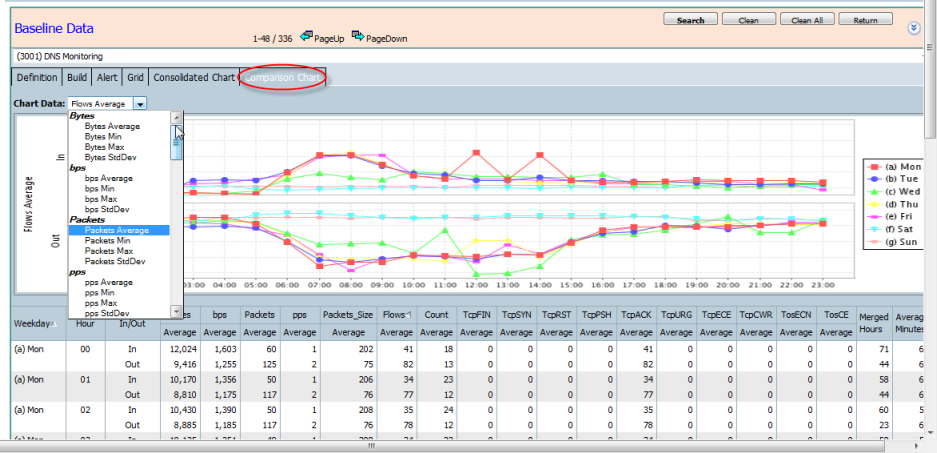
The "Comparison Chart" tab
shows the chart for the selected measurement by minute statistics data on a single graph showing averages, minimums, maximums and standard deviations for each hour of each weekday selected in Search.