Top X/Y is very flexible and open to your imagination allowing unprecedented visibility of your network traffic. It can be used to provide simple 'birds-eye' view analytics such as "Show the Top 5 applications and Conversations for each ASN Peer" or more granular identification such as "Show the Top 100 Threat (IPs, Categories, Type) and for each Affected IP".
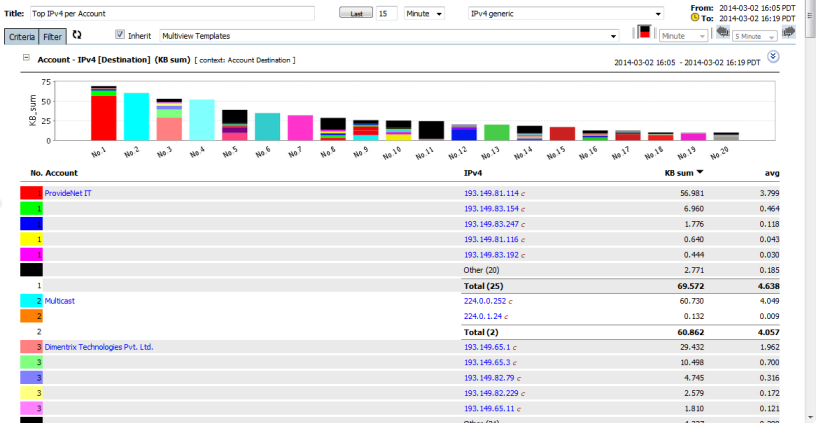
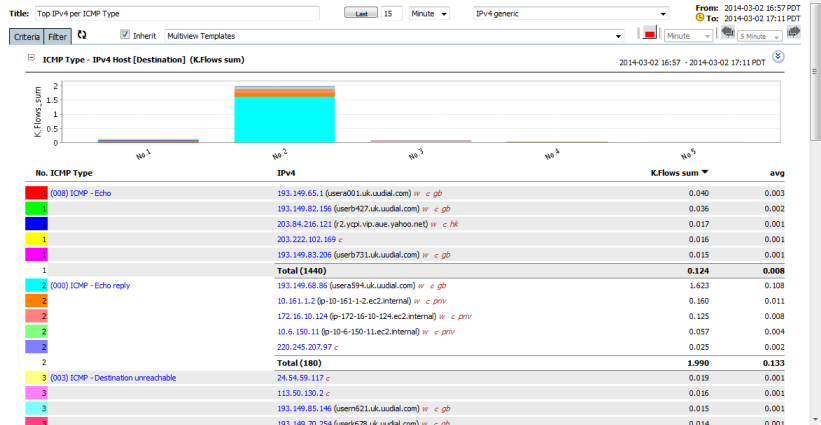
A simple example of a cross-sectional analysis is an analysis of the Top 10 Applications (X) for each hour (Y) over a Day. In this example (see figure1) below each Application is assigned a distinct color so that it can easily be identified within each hour
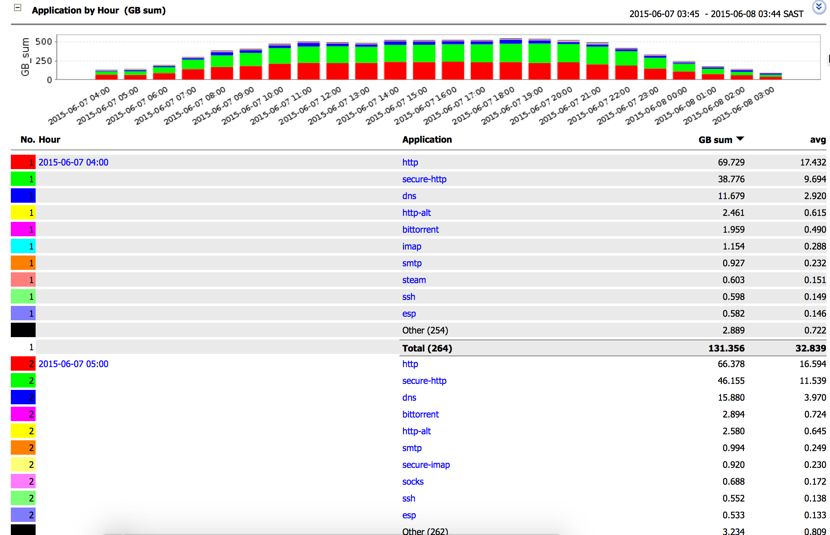
figure1
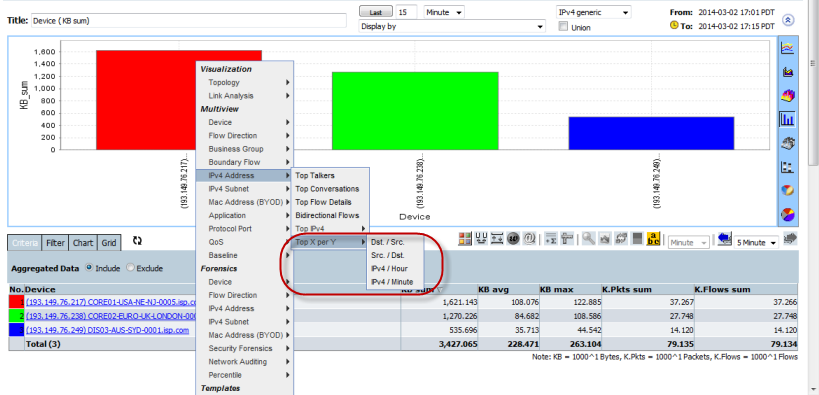
The X/Y analytics that are available as Multiview Reports can be identified by the "/" in the Report title.The default X/Y reports or your own unique cross-sectional analytics can be accessed via the left menus or the right click menu. Where the right-click menu is used the meter measurement will follow the current meter sort order.
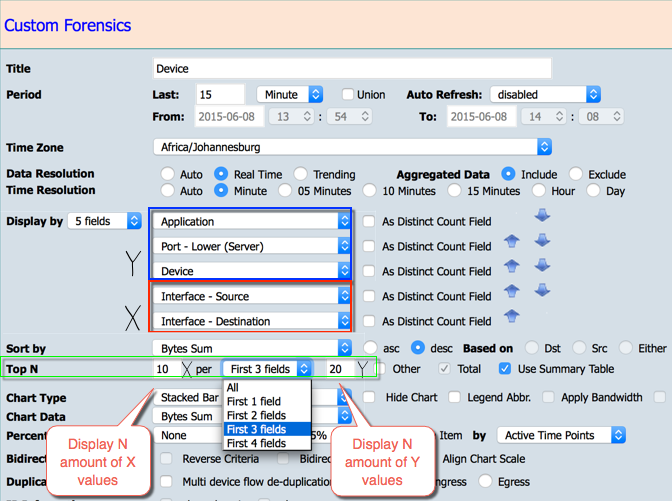
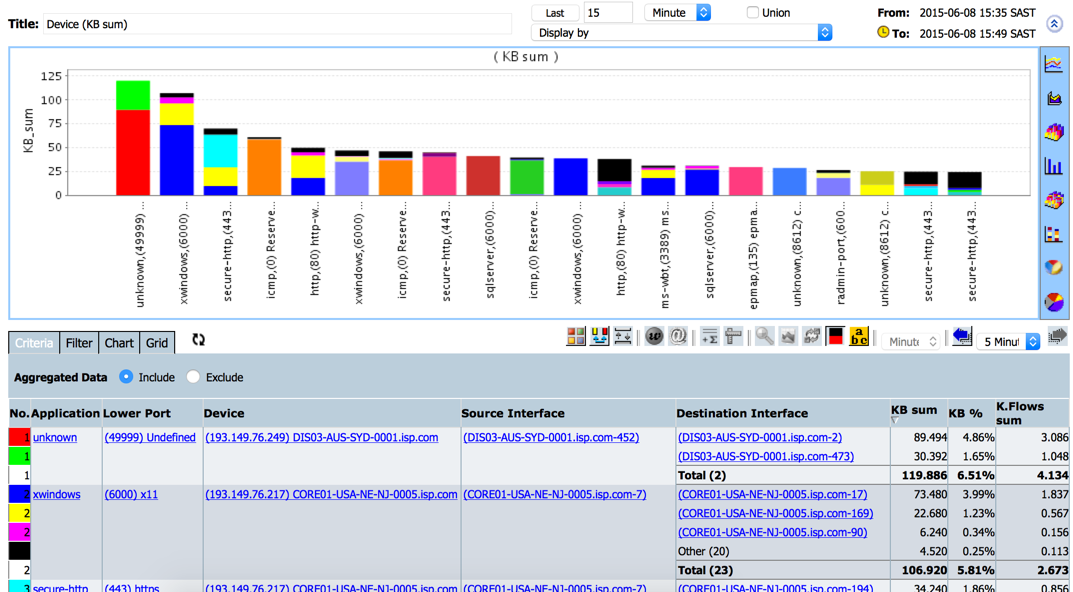
The graphic display of a Top X/Y is always a Stacked Bar Chart. The colors of the elements of the Stacked bar chart are the "X" items in the report. The "X" and "Y" cross-section can be made up of more than 1 field but there are always only two logical "X" and "Y" cross-sections
e.g. X(1,2) / Y(3,4,5,6)
The "X" elements are the granular details of each "Y" items in a report.e.g.
Y X Value Y1 X1 9 X2 9 X3 9 Y2 X1 9
The Filter allows the creation of a Top X/Y for any two or more fields.
The Forensic screens Filter tab (below the graph) also provides access to the Top N control element enabling on the fly changes to Top N detail.
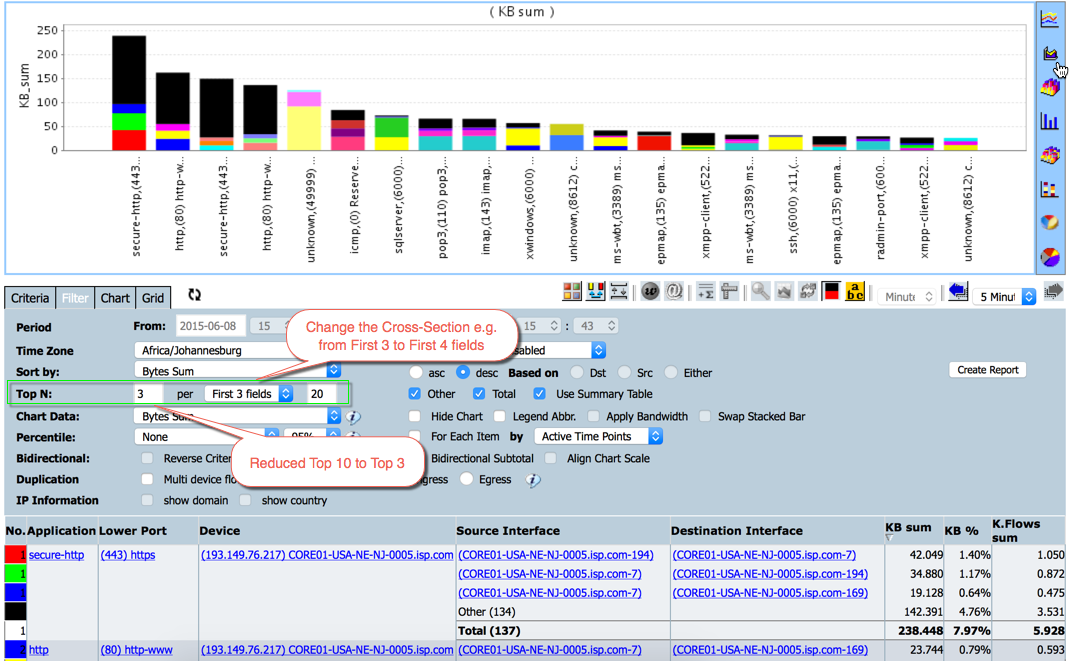
Where more than 1 field is available the Top N control element provides the ability to change the cross-section.
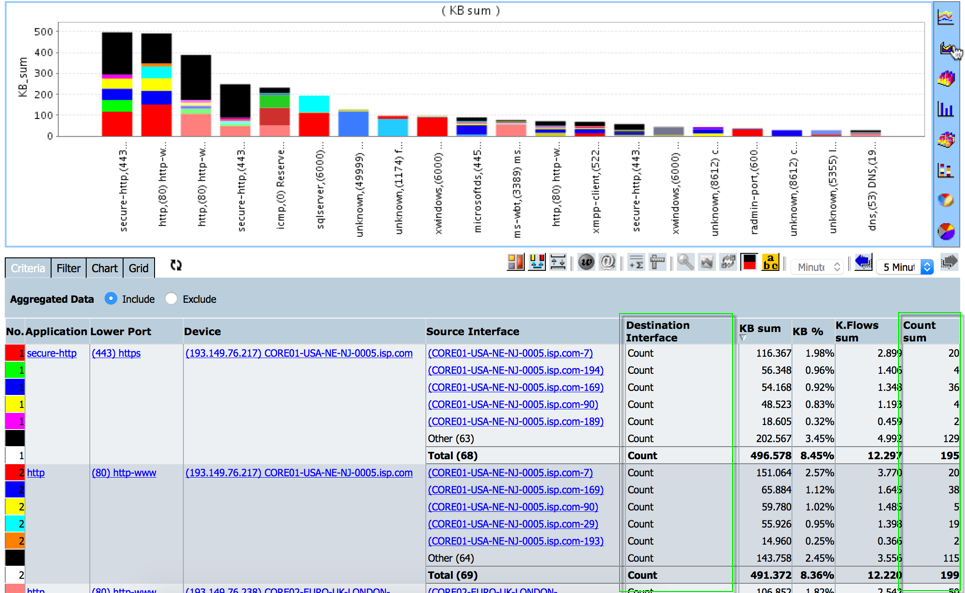
The Count algorithm is supported in Top X/Y where the X fields has 1 uncounted field.
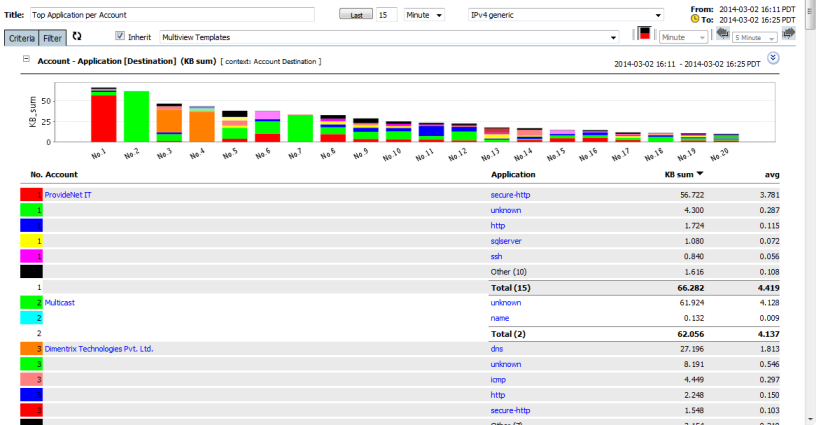
A number of default X/Y analytic templates are available in the Multiview and in the Forensic left menus. Some examples are shown below:
Security Forensics
Multiview
Flow Direction
Interface Routes
Routes and ToS
Account
Flow Detail
Business Group - Account
IPv4
Application
Business Group - CostCenter
IPv4
Application
ASN
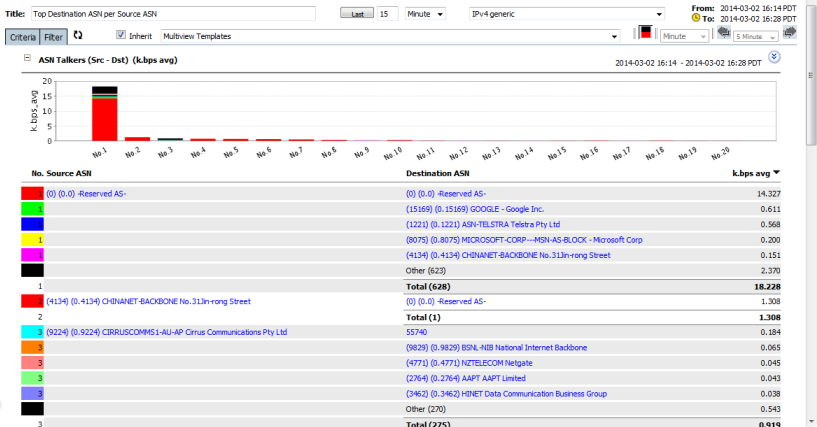
Dst. / Src.
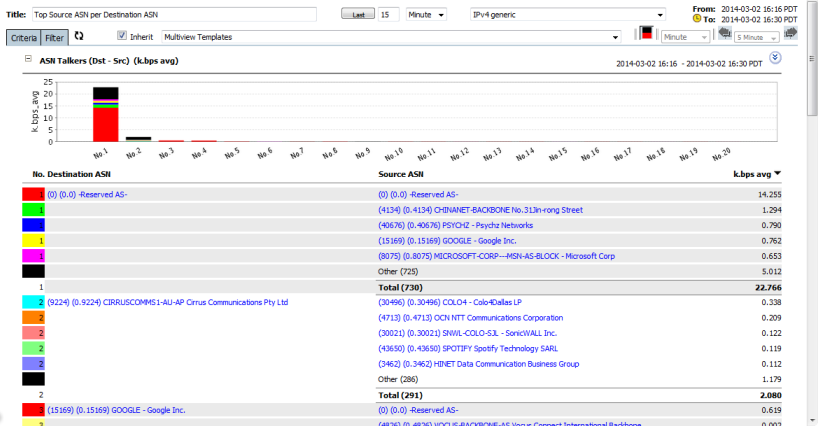
Src. / Dst.
Boundary Flow
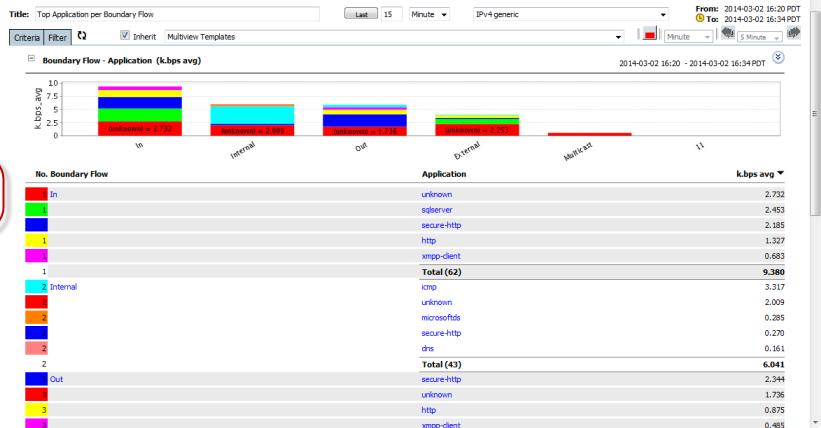
Application
Lower Port
Unknown Service
ToS Precedence
PHB Class
IPv4 Address
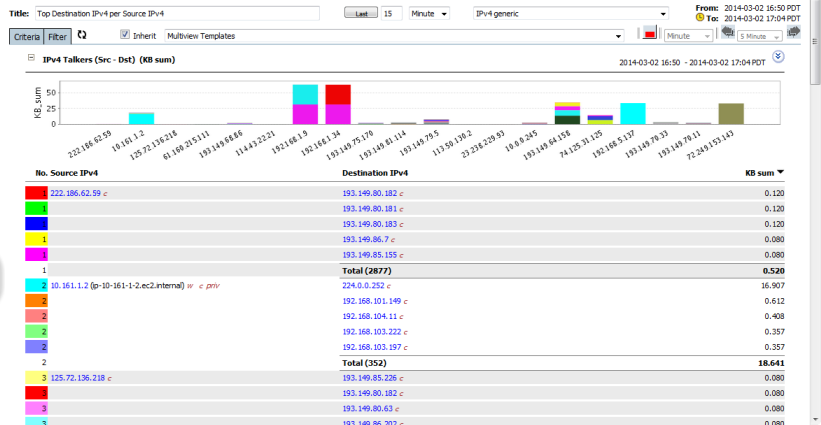
Dst. / Src.
Src. / Dst.
IPv4 / Hour
IPv4 / Minute
Application
IPv4/ICMP Type
IPv4/ICMP Code
IPv4 / App.
Talkers / App.
App. / Hour
App. / Minute
QoS
Application / ToS
Application / DSCP
Application / PHB
Lower Port / ToS
Interface / ToS
PHB Class / Day
PHB Class / Hour
Forensics
Device
Next Hop
Hop / Device
Device / Hop
IPv4 Addressz
Dst. / Src.
Src. / Dst.
Talkers / Hour
Talkers / Minute
Packet Size
Pkt. Size/App.
App./Pkt. Size