Forensics: 2.(a) Time Chart Zoom
Posted: Tue Aug 14, 2007 12:12 pm
Zoom into a Report
The zooming functionality is available for the CySight charting applet. Users can zoom into all bar, line and area charts.
You can zoom into a report to reveal more intricate details.
Note: By default (except in the case of a baseline report) the grid will update as you select a time area. To "float" through the graph data without the grid updating, click "Chart tab" and disable the "Zoom Option".
To zoom down into a report:
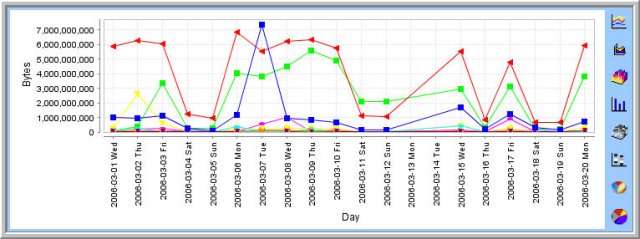
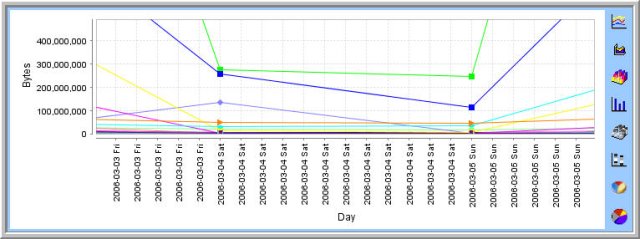
Step 1: Generate a report. Following is an example of a weekly baseline report.
Step 2: For line charts focus choose zoom mode ( ). Zoom mode is a toggle option of Drag mode click on drag mode (
 ) to change to zoom mode.
Step 3: Drag the mouse to select an area within the graph into which you wish to drill down.
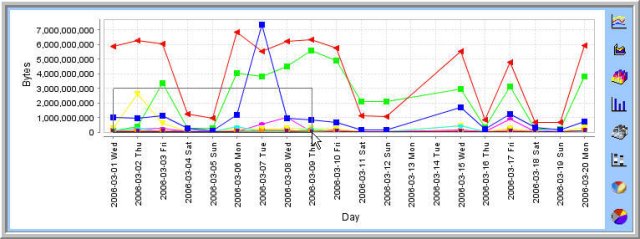
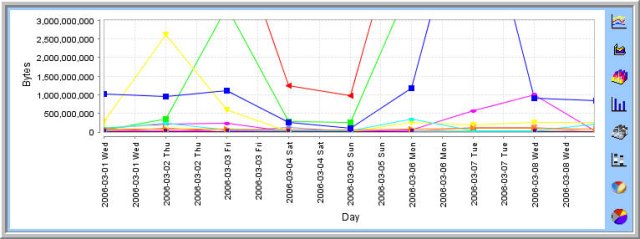
Step 4: A new graph is displayed elaborating only the selected area with greater detail.
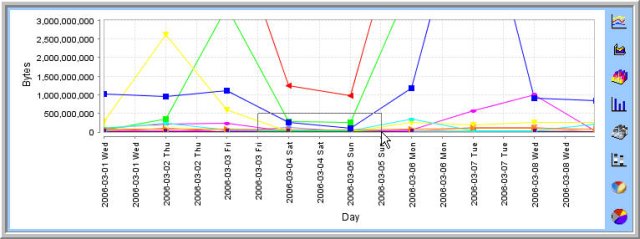
Step 5: Repeat Step 2, as many times as you want.
The zooming functionality is available for the CySight charting applet. Users can zoom into all bar, line and area charts.
You can zoom into a report to reveal more intricate details.
Note: By default (except in the case of a baseline report) the grid will update as you select a time area. To "float" through the graph data without the grid updating, click "Chart tab" and disable the "Zoom Option".
To zoom down into a report:
Step 1: Generate a report. Following is an example of a weekly baseline report.
Step 2: For line charts focus choose zoom mode (
). Zoom mode is a toggle option of Drag mode click on drag mode () to change to zoom mode.Step 3: Drag the mouse to select an area within the graph into which you wish to drill down.
Step 4: A new graph is displayed elaborating only the selected area with greater detail.
Step 5: Repeat Step 2, as many times as you want.