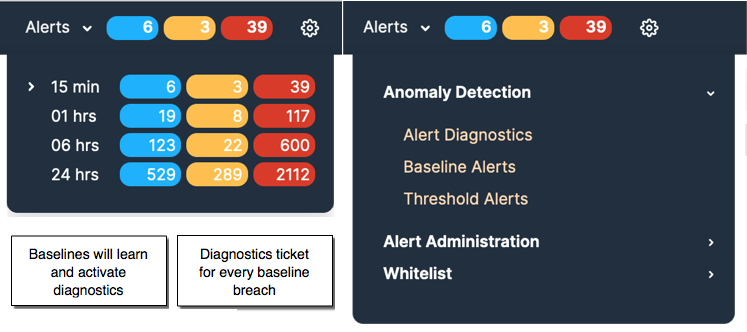
The My Alert Menu
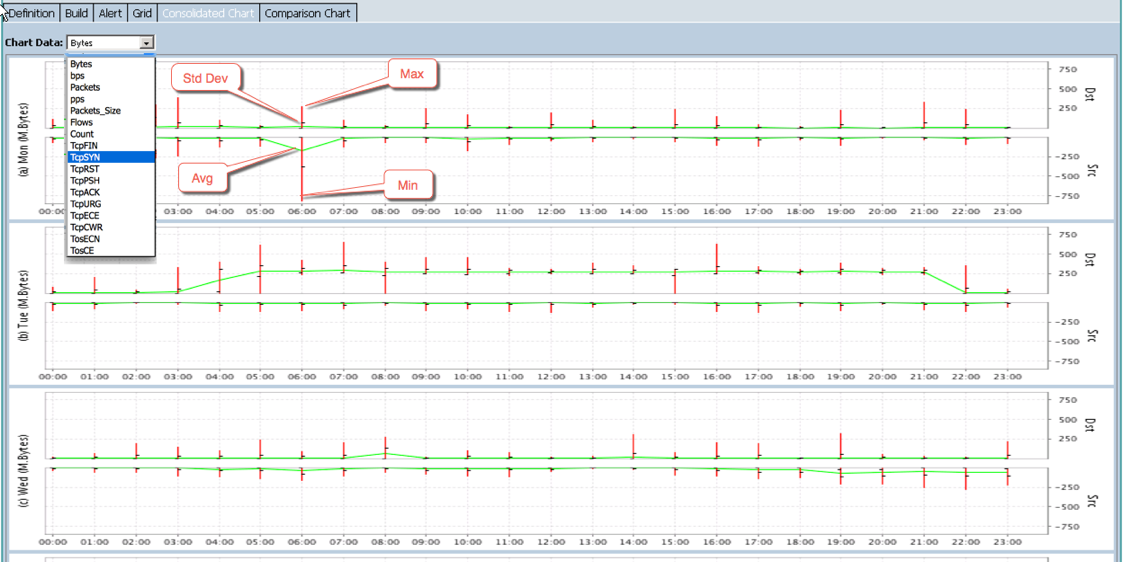
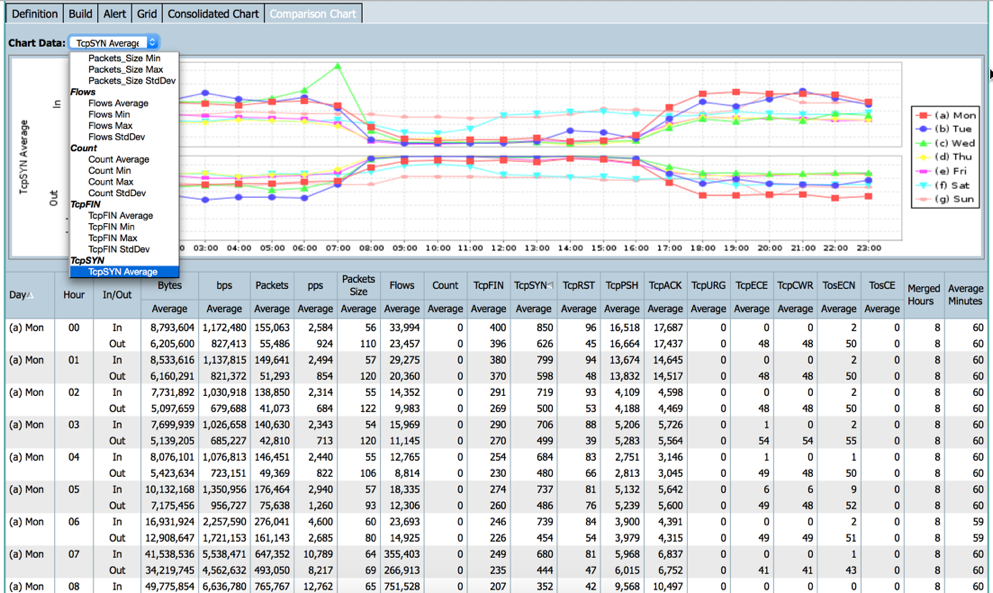
In the Baseline Examples you can see baselines learned for flow and byte meters for each day of the week, for each hour of the day by Average, Minimum, Maximum and Standard Deviations.
When a Baseline for a Meter is breached the diagnostics process analyzes and discovers where possible the dominants of the traffic and then analyzes to find the traffics sub-dominants highlighting recurring issues with easy diagnostics alerts NOC screen.
Diagnostics Example
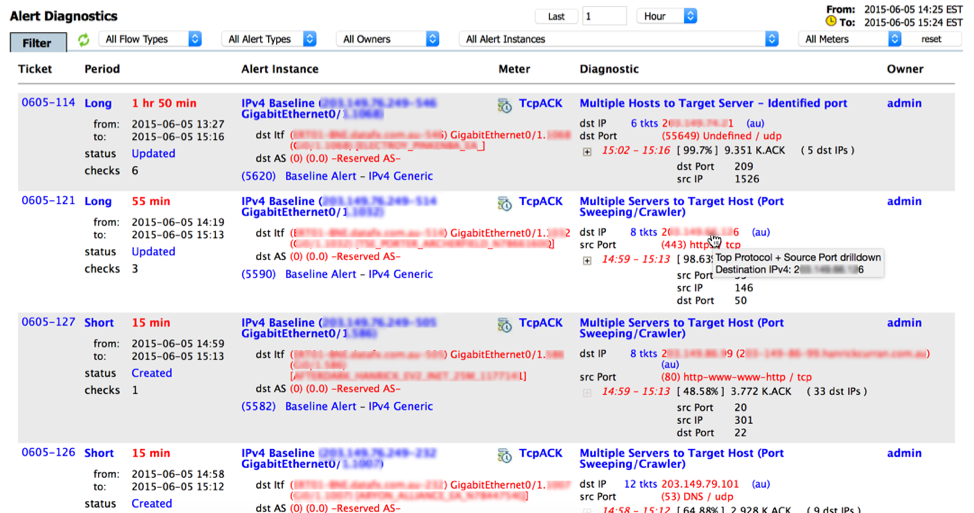
Each ticket allows red links to drill in to show the traffic detail that produced the diagnostic. This enables you to quickly identify and focus only on the most important traffic breaches.
Diagnostics: 1. Introduction
Diagnostics: 2. Setup baseline learning
Diagnostics: 3. Monitoring Alerts and Tickets
Diagnostics: 4. Diagnostics screen deciphered
Diagnostics: 5. SNMP Traps and Email Notifications